↩ Tim Sahre

Environmental Informatics | Bridging Technology & Ecology for Better Futures
Interested in learning and implementing multidisciplinary approaches to complex questions and passionate about utilizing technology to solve pressing environmental challenges, my academic path has been a blend of environmental science and IT. During my studies, I mastered crucial technical skills in environmental information systems, databases, and web technologies, further developing my expertise in environmental analysis. I worked on projects ranging from the use of environmental information systems to ecological data analysis, combining theoretical knowledge with practical applications to solve contemporary environmental problems.
View My LinkedIn Profile
Various Visualizations for Germany Using Boundary Masks [ ]
]
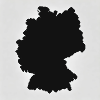
This project explores different techniques to create unique visualizations constrained by the boundary mask of Germany.
| Description | Visualization |
|---|---|
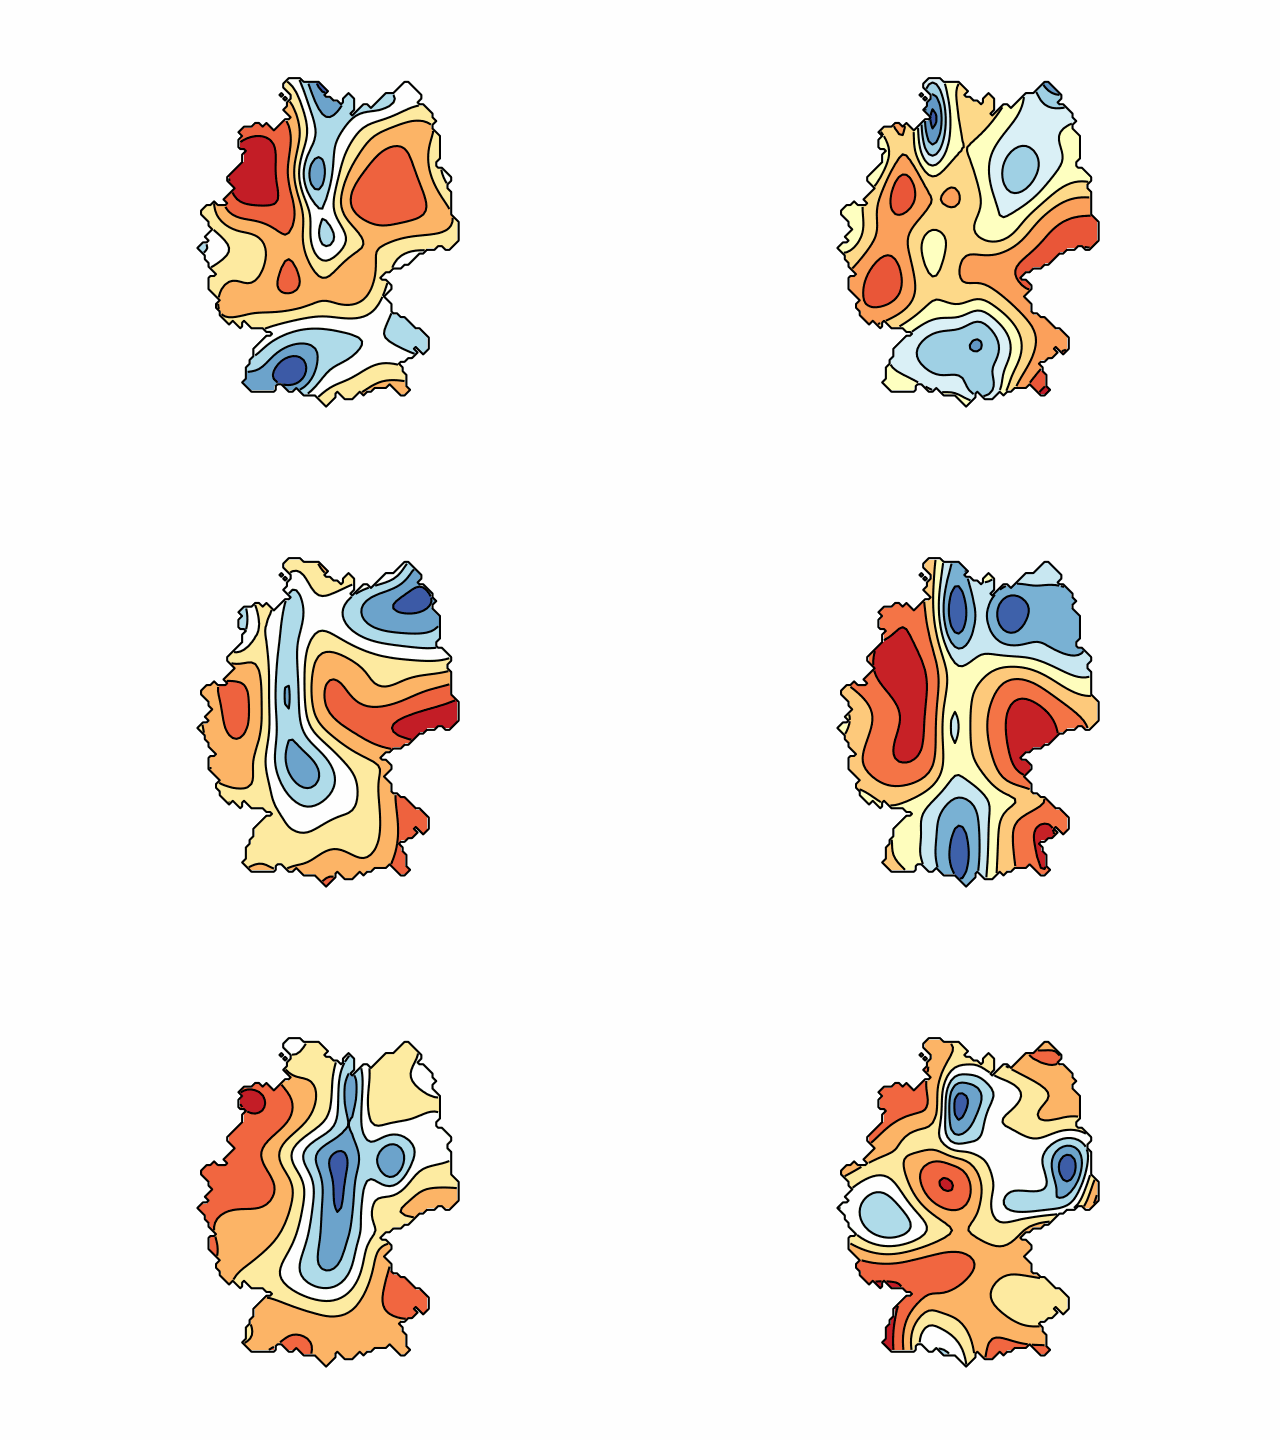
| 1. Animated 2D Gaussian Visualization Dynamic 2D Gaussian functions (bell curves) are displayed within the borders of a mask based on a black-and-white representation of Germany. The Gaussians change their position, width, and amplitude randomly over time, resulting in a vivid, evolving animation. Areas outside the mask are excluded, and the animation is saved as a .gif. |
 |
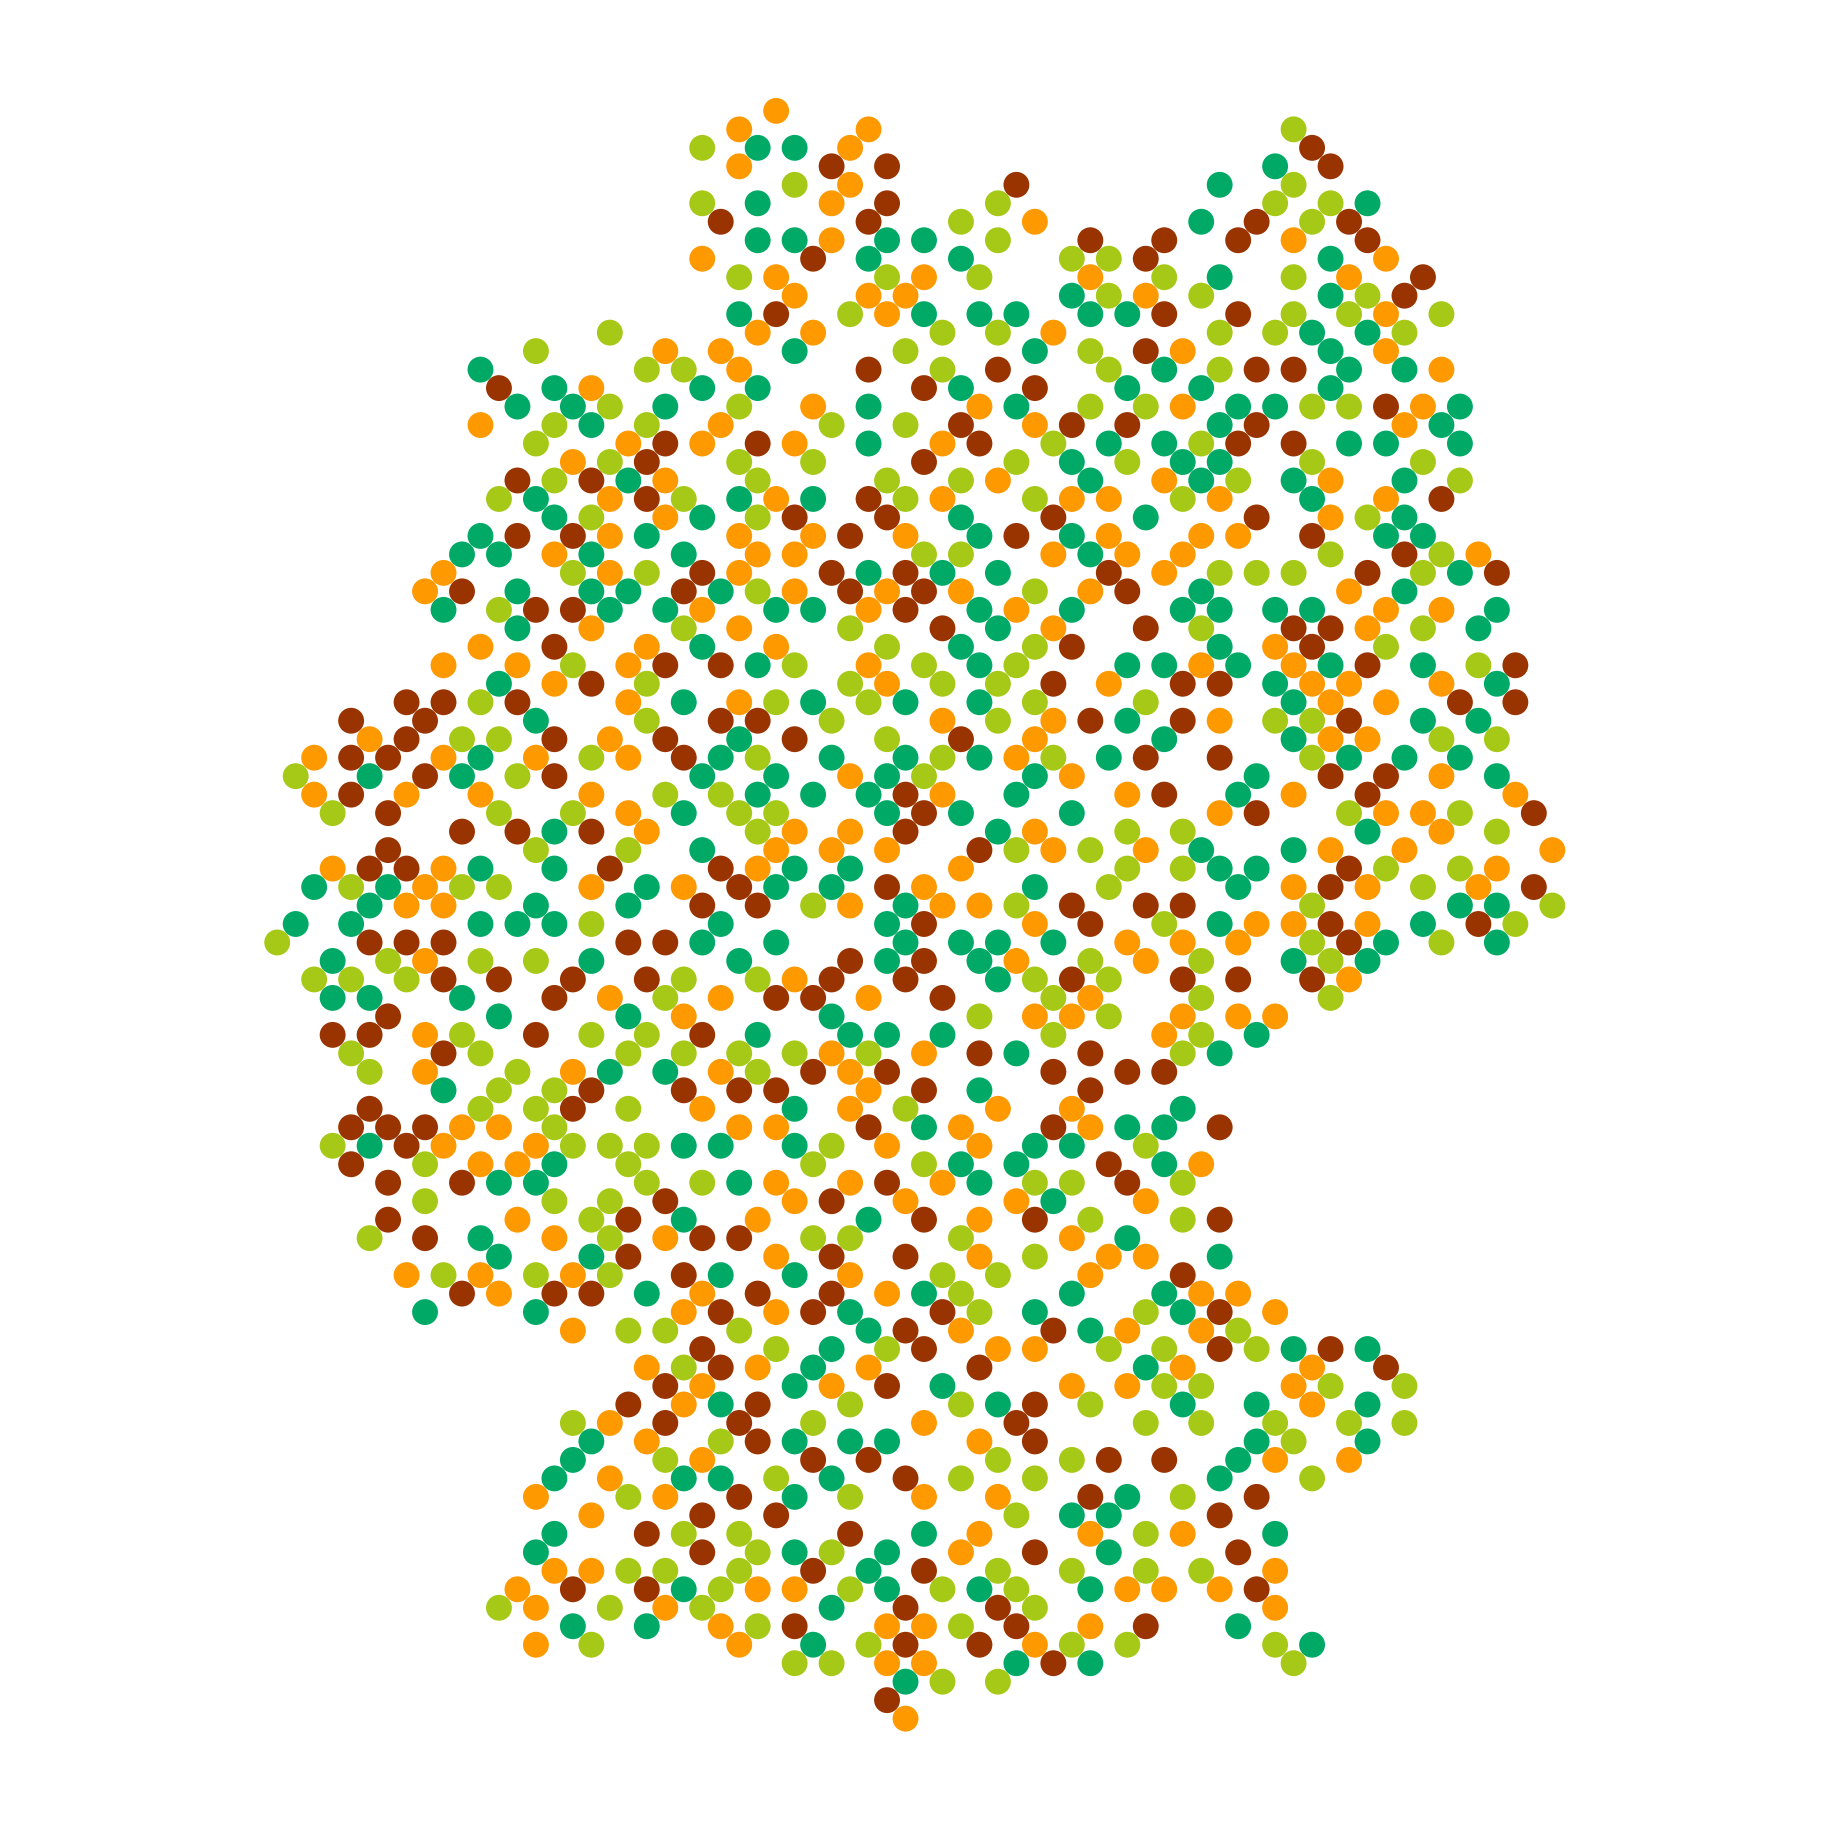
| 2. Filling a Mask with Circles This visualization fills the shape of Germany with randomly placed colorful circles of fixed size. The circles are positioned within the black areas of the mask without overlapping, creating an aesthetically pleasing result. A predefined color palette enhances the visual effect, and the output is saved as an image. |
 |
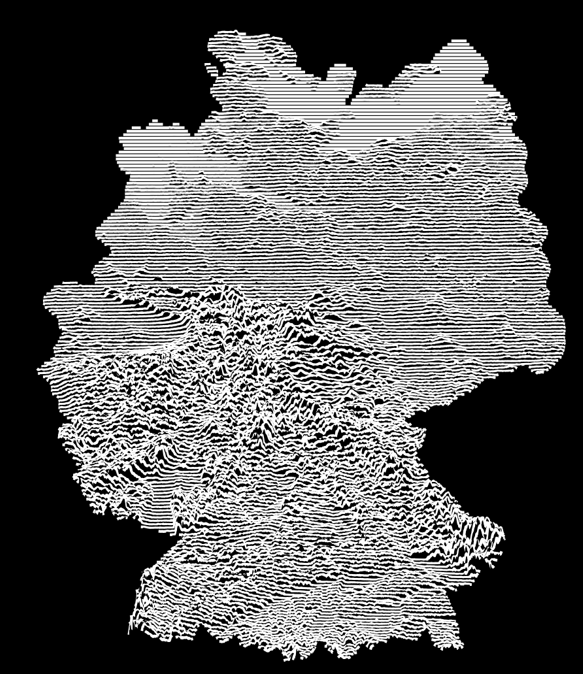
| 3. Elevation Line Visualization This visualization uses a topographic elevation dataset for Germany, downscaled and masked to match the boundary of the country. Lines are drawn horizontally to represent different rows of elevation data, with a vertical offset applied to create a layered effect. Every fifth line is displayed in white, while others are excluded, resulting in a stylized, clean visualization. The output is saved as an image. |
 |